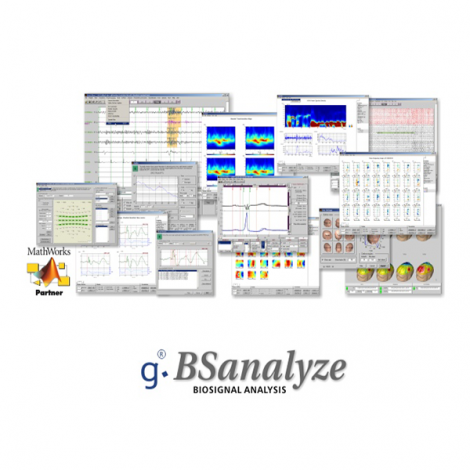
g.BSanalyze is an interactive environment for multimodal biosignal data processing and analysis in the fields of clinical research and life sciences. g.BSanalyze has been on the market for more than twenty years, and is used in more than 70 countries. It is the most comprehensive package available to analyze non-invasive and invasive brain-, heart- and muscle-functions and dysfunctions. The package won several international awards. The new version includes many new functions such as topographic plots, CCA, new filters, an importer for cortiQ files, updates for Result2D, Cortio-Cortical Evoked Potentials, an ECoG toolbox, a TMS toolbox and more!
The package comes with many sample biosignal data-sets, including P300, SSVEP, motor imagery, CSP BCIs, Tilt-Table, EPs, multi-unit activity, CFM, CCEP, and ERD/ERS.
PRODUCT HIGHLIGHTS
| Interactive and intuitive graphical user interface for EEG, ECoG, EOG, EMG, ECG, spikes, and physical data analyses and documentation under MATLAB as well as a stand-alone version |
| Extensive tools for data processing in time, space, and frequency domains |
| Powerful 2D and 3D visualization tools to rapidly generate publication ready figures |
| Enhancement of power with g.tec’s specialized EEG, ECoG, Cerebral Function Analysis, Cortico-Cortical Evoked Potentials, ECG, Spike, Classification and High-Resolution EEG toolboxes |
| Flexibility to integrate other MATLAB toolboxes, as well as customers’ specific algorithms |
| Analyse data from g.Recorder, g.HIsys, MATLAB and C API and many other third-party recording devices |
| The only package that supports all BCI principles such as P300, motor imagery, SSVEP/SSSEP, slow cortical potentials, cVEP |
| Optimized for high-gamma activity analysis |
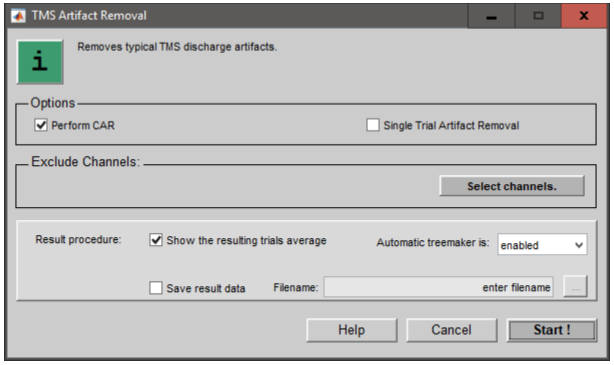
| Discharge artefact removal algorithms for TMS experiments |
AVAILABLE TOOLBOXES
| EEG toolbox: specialized functions for pre-processing, analysis and parameter extraction for EEG data |
| ECG toolbox: find QRS complexes and calculate heart rate variability parameters |
| Classification toolbox: classify parameters with linear and non-linear methods including statistical analysis for zero class detection |
| High-resolution EEG: map EEG activity on realistic head models |
| Cerebral Function Analysis toolbox: calculate amplitude integrated EEG |
| Spike toolbox: analyze spikes, multi-unit activity and positions to map physiological parameters |
| Cortico-Cortical Evoked Potential toolbox: calculate CCEPS from ECoG recordings |
| ECoG toolbox: analyse EEG data from implants |
MORE THAN 100 FUNCTIONS
g.BSanalyze’s graphical user interface includes more than 100 state-of-the art functions for defining electrode montages, spatial or temporal filter designs, artifact treatment, quality control, spectral analysis, coherence, correlation, bandpower analysis, ERD/ERS analyses, EP analyses, visualization, data set classification, and other goals.
It is the only package that supports all BCI principles: P300, SSVEP/SSSEP, cVEP, motor imagery and slow cortical potentials. You can load and save your preferred processing steps within a script program and automatically process your data in g.BSanalyze batch mode.
ALL YOU NEED FOR BIOSIGNAL ANALYSIS
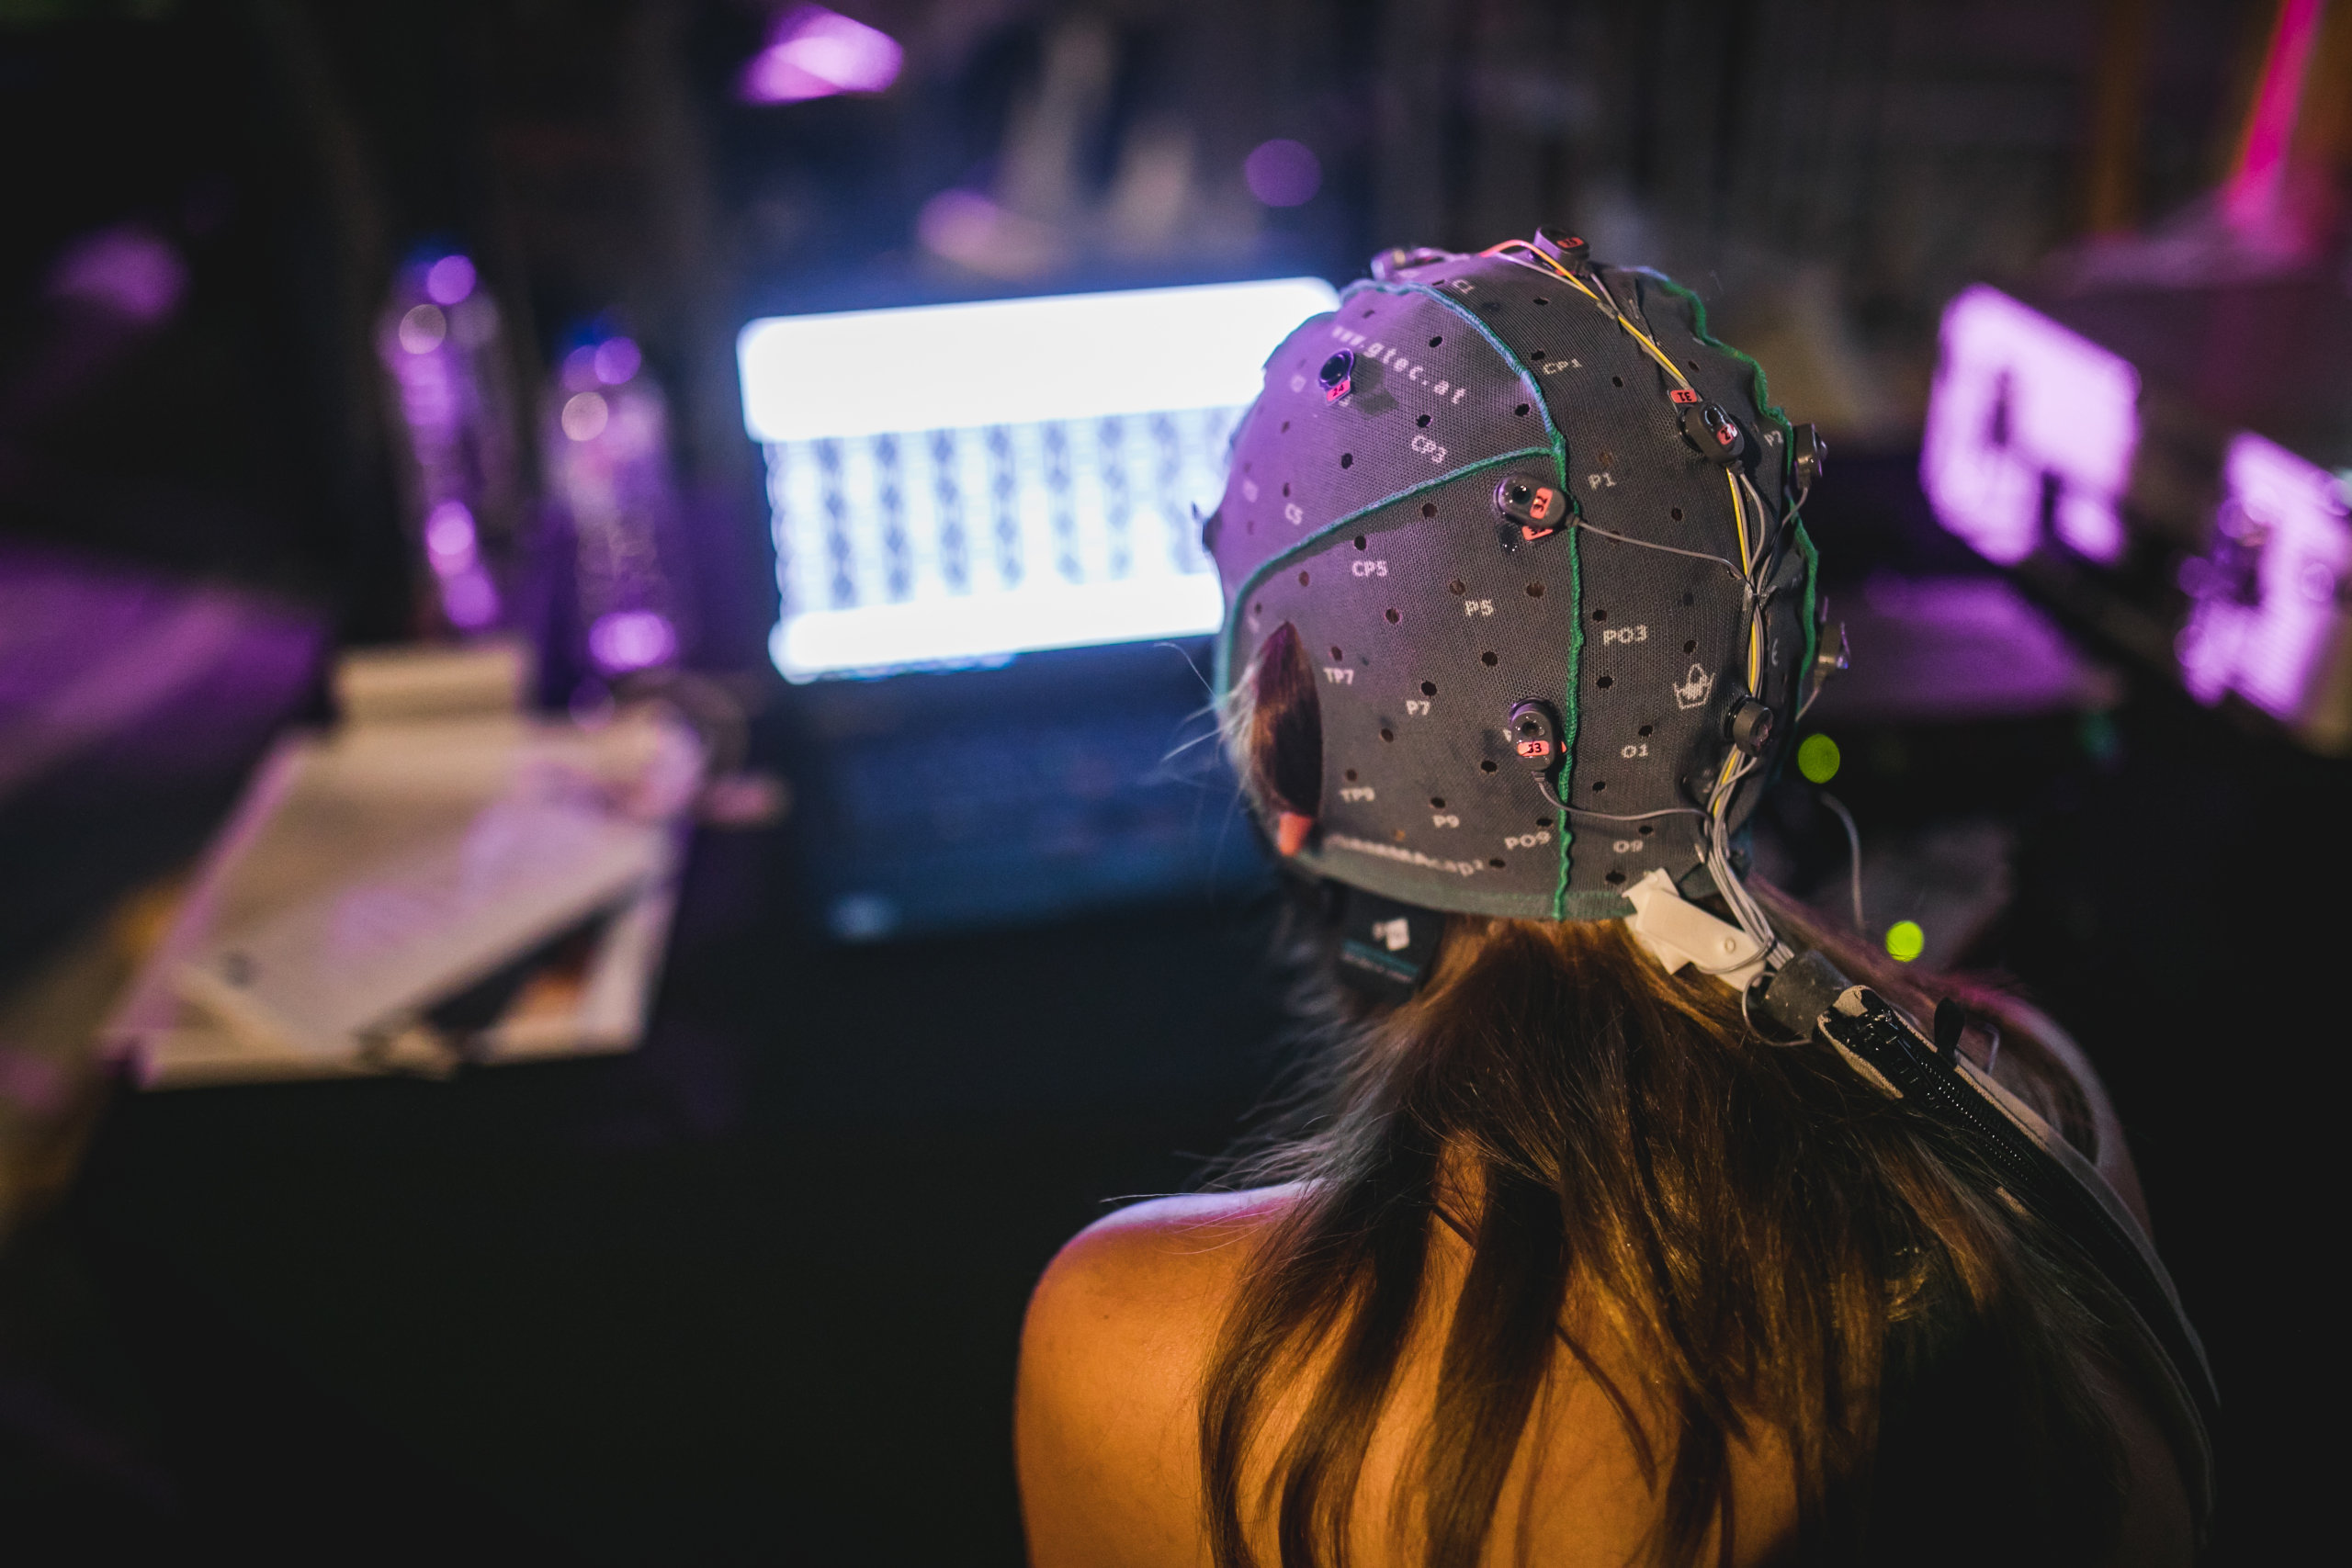
g.BSanalyze’s processing capabilities allow you to extract relevant features from your multimodal data and define useful parameters for post-processing. Use these parameters directly with g.BSanalyze’s classification tools to assign distinct classes to your data with linear and non-linear classifiers.
The combination of the graphical user interface and the programming environment makes g.BSanalyze a truly unique package for biosignal analyses. The standalone version of g.BSanalyze can run without a MATLAB installation, but batch processing in the MATLAB command window is not possible.
G.TEC SUITE 2020
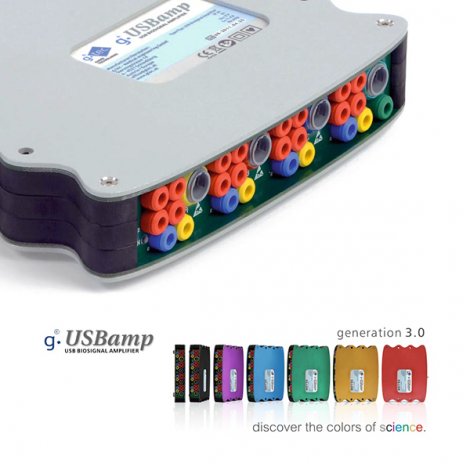
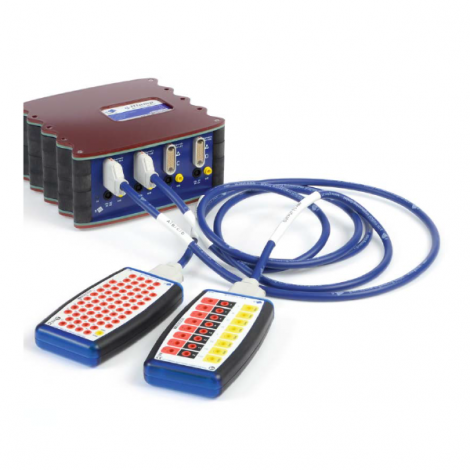
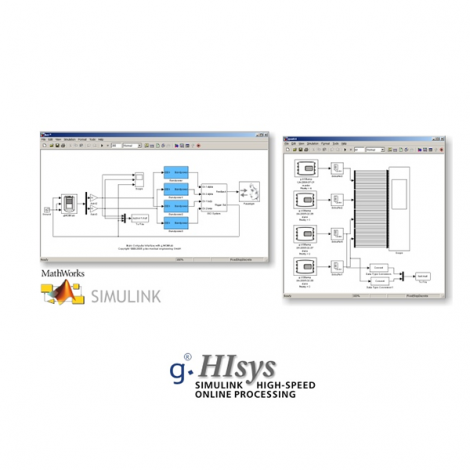
The g.tec Suite 2020 contains all software packages from g.tec, such as g.NEEDaccess with all APIs, g.HIsys, g.Recorder and g.BSanalyze. It allows an easy installation, update and organization of all software packages, and comes with an automatic software compatibility check to minimize any software issues on your computer.

TRANSFORMATION
Cut trials-samples-channels, Sort data, Merge data sets, Arithmetic operations, Data triggering (on multiple triggers), Untrigger data
TOOLS
Stimulus/response detector, Reaction time analysis, Single trial analysis, Trigger finder
DATA VISUALIZATION
Data ruler, Undo (1-step, multi-step), Journal file, Full header access, High speed data scrolling (trial x channel/channel x trial), Assign and edit data attributes and markers, Epoching (free/multi trial/multi channel mode), Data scoring, Quick analyses of epochs, Assign comments, Attribute jumper, Data status monitor, Data player, Zoom, Data scaling (auto, amplifier, manual, type specific)
PRE-PROCESSING
DC-correction, Smoothing/Rectifying, Data de-trending, Remove drift, Down- and up-sampling, Filter data (highpass, lowpass, bandpass, bandstop), Filter design with graphic support, Spatial filtering, Moving average, Baseline correction
ANALYZE
Independent Component Analysis (ICA), Principal Component Analysis (PCA)
DATA FILE I/O AND PRINTING
Import filter: recoveriX, mindBEAGLE, cortiQ, MATLAB, EDF, BKR, ASCII, RDF, CNT, TFM, MOBILAB, AXONA, BIOPAC, MICROMED, MIT, BIOSEMI, Block import, Full support for third-party formats, Export ASCII, Assign class labels, Plot data, Printer options
BATCH MODE
Automatic generation of journal files, Batch mode processing for multiple data sets, Automated Batch Starter
ARTIFACT TREATMENT
Overflows, Zerolines, Eventfinder with automatic attribute/marker assignment, Artifact removal with ICA/spatial filters, Automatic artifact epoch detection
ANALYZE FUNCTIONS
Data quality (histogram, distribution and statistic measures), Average across trials (EP analysis, baseline correction, SNR, graph comparison, …), Power spectrum analysis and significance test of differences, Wavelet analysis
RESULT VISUALIZATION
2D plots of analysis results, Layout editor, Copy and measure, Background image, ASCII export, Clone plots, Topography, Header editor
PRE-PROCESSING
Source derivation
PARAMETER EXTRACTION
Adaptive autoregressive (AAR) parameters, Signal variance, Bandpower, Exponential window, Cross correlation and CC-based template matching, Minimum energy
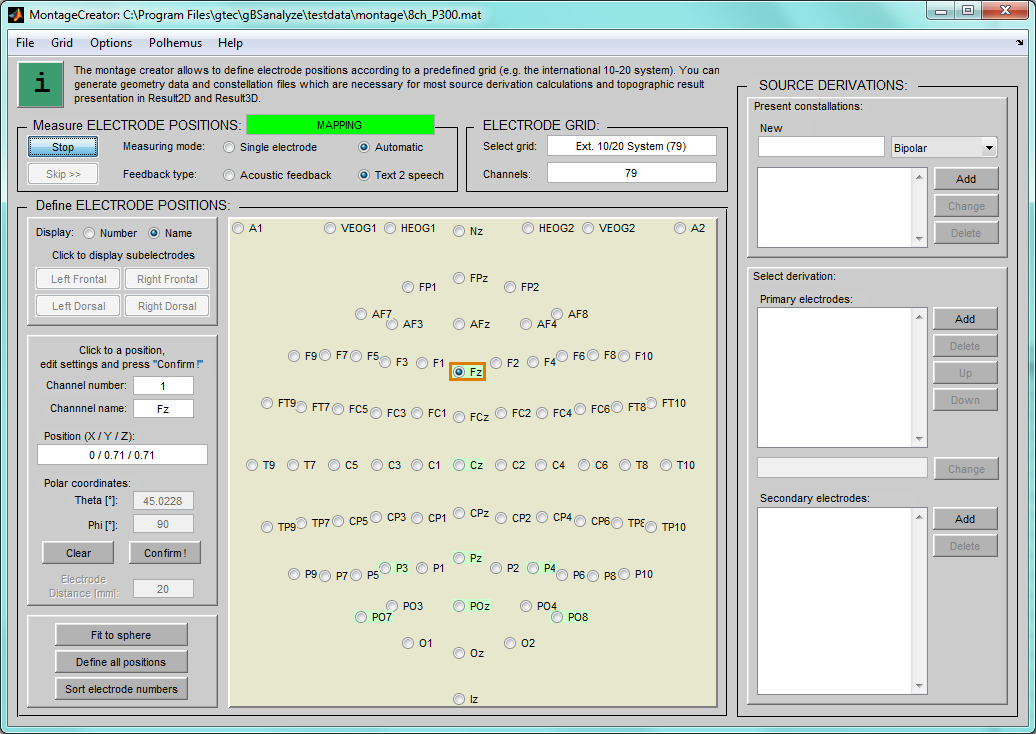
MONTAGE CREATOR
Edit topography/electrode positions according to the international 10-20 system or free electrode system, Specify source derivations (BIP/CAR/LAR/LAP,…), Edit geometry data
HEART RATE VARIABILITY
HR/HRV time domain parameters, Geometric measures, RR difference measures, Segmented measures, Poincarè plots, HR/HRV frequency domain parameters, Power measures, Normalized measures, HRV time-frequency maps
PARAMETER EXTRACTION
Tachogram
ECG SPECIFIC ANALYZE FUNCTIONS
Coherence, Event-related coherence, Event-related ECG changes
QRS/R-PEAK DETECTOR
Automatic R-peak detection and marker assignment
EEG SPECIFIC ANALYZE FUNCTIONS
Coherence, Event-related coherence, ERD/ERS analysis with significance test, ERD/ERS time-frequency maps with bootstrap test for significance, ERD/ERS time-frequency maps with complex demodulation, ERD/ERS time-frequency maps with wavelets, ERD/ERS time-frequency maps with Hilbert transformation, Common spatial patterns (CSP), Mean frequency, Phase-locking value, Averaging function with statistical comparison of different classes, EP calculation (ASSR, MNN, BAEP, P300, N400, …)
ARTIFACT TREATMENT
TMS artifact removal
PARAMETER EXTRACTION
Hjorth parameters, Barlow parameters, Running fractal dimension, Temporal and spatial complexity, Minimum energy for SSVEP- and SSSEP-based BCI, P300 BCI accuracy
METHODS
Multi-class linear discriminant analysis, Minimum distance classifier, Backpropagation neural network, Receiver operator curves, Radial basis function, Distinction sensitive learning vector quantization (DSLVQ), DSLVQ for feature weighting, K-means clustering, Support vector machine, Change rate/majority voting, Zero-class, P300-accuracy, Plot classification result
TOOLS
Generate feature matrix, Generate time segment feature matrix, Test classifier, Apply classifier, Store classifiers for online application (biofeedback, BCI, …)
CEREBRAL FUNCTION ANALYSIS TOOLBOX FEATURES

Features Overview
- Offline Analysis of Neonate EEG
- Automatic CFM Segmentation
OFFLINE ANALYSIS OF NEONATE EEG
The CFM (aEEG) signal can be computed from selected data segments. The CFM traces are displayed in a viewer window for visual inspection.
AUTOMATIC CFM SEGMENTATION
CFM traces can be classified automatically. The following classes are assigned to data segments of a predefined length (e.g. 10 min): CVP (continuous voltage pattern), DLVP (discontinuous low voltage pattern), DHVP (discontinuous high voltage pattern), ISO (isoelectric pattern), BSP (burst suppression mode), BURST (bursts). Criteria for automatic segmentation can be adjusted/optimized for special applications or derivation techniques.
PRE-PROCESSING
High resolution spline Laplacian derivations for ERD/ERS, ERP, etc.
ANATOMICAL MODELLING
Generation of realistic anatomical multi-layer models from segmented CT/MRI data, Fit electrode positions to models, Edit geometry data.
RESULT MAPPING
2D and 3D mapping of results for different model layers, Edit transparency and colors, Free rotation of models/maps, Generate time series.
NEURONAL ACTIVITY PROCESSING
Firing rate of neural cells
PSTH – PERISTIMULUS TIME HISTOGRAM
Firing histogram to identify active regions
CALCULATE SPEED
ANALYZE POSITION DATA
Movement trajectories, Visits per class, Class probability, Dwell time
CALCULATE DIFFERENT MAP PARAMETERS
Firing fields, Skaggs index, Spatial coherence, Spatial selectivity, Mean non-zero-rate, Maximum activity, Minimum activity

